RiverFlow2D StatisticsPurpose
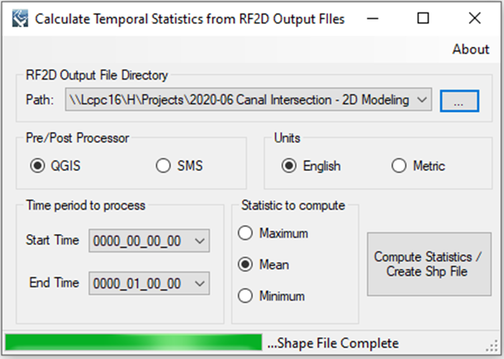
This tool allows the calculation of maximum, minimum, and mean values from a sequence of RiverFlow2D output files and creates a point shape file. Usage The user must simply select the directory the RiverFlow2D output files. The pre-/post-Processor GUI (i.e., SMS or QGIS), units (i.e., SI or English), as well as the start and end time with be detected based on the output files within the directory. The user may decide to select a different time range and the statistical parameter to calculate (i.e., Max, Min, or Mean). When executed, the tool generates a point shape file with the centroids of the model triangular elements and the calculated statistical parameter for the velocity magnitude, water surface elevation, water depth, and bottom shear stress; as outputted by RiverFlow2D in the desired time range. Pre-requisites It is not necessary to have RiverFlow2D installed to run the tool. Example of use There are no example files included in the installation to try this tool. The printscreen below illustrates the use of the tool. 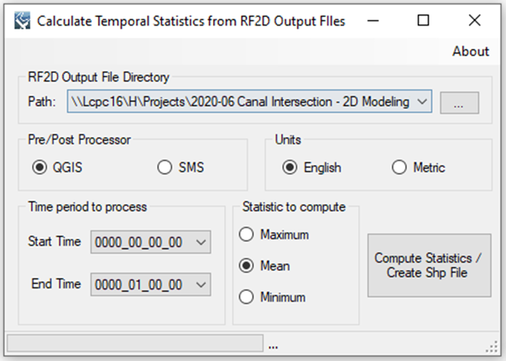
Registration
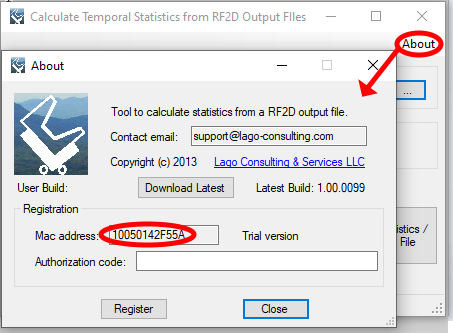
In order to have full functionality of this tool, the user needs to complete the registration by following these steps: Go to the right-top corner in this tool, click on the “About” button, and copy the Mac address shown there.
In this tool’s webpage, use the box above the "Add to Cart" button to enter the Mac address. Then, click on the "Add to Cart" button right below to enter your payment information.
After these steps, the authorization code will be sent to the email that you provided during the PayPal payment process.
Support Users can report bugs and send comments by email to [email protected]. Created by Lago Consulting & Services LLC. © 2020. Last updated on 07/22/2020
|

|