Adjust a dfs2 File based on MIKE SHE StatisticsPurpose
This tool allows the adjustment of a parameter map in a dfs2 file based on MIKE SHE statistics from two or three simulations. This may be helpful during the calibration process of complex MIKE SHE models when sensitivity tests to a spatially-varying parameter (such as SZ hydraulic conductivities) are conducted. In the case that the variation of the calibration parameter may result in better or worse statistics at observation stations in different areas, the user may want to find a new “composite” map by choosing parameters from the previous maps from areas where the statistics is best. This tool offers a quick and convenient way to obtain the new map that often produces better overall statistics with respect to the previous simulations. An optional polyline shape file can be specified in order to consider that the cause of better or worse statistic results at some stations are rather distributed in space and not assigned to the specific station locations. This may be the case at stations located at streams and lakes. Usage
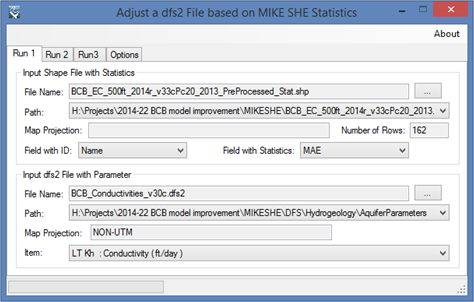
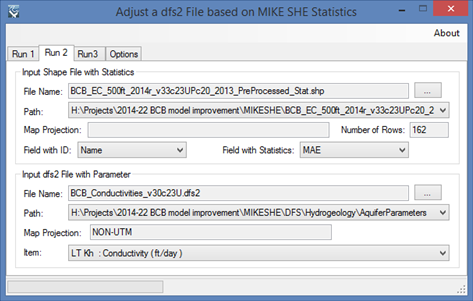
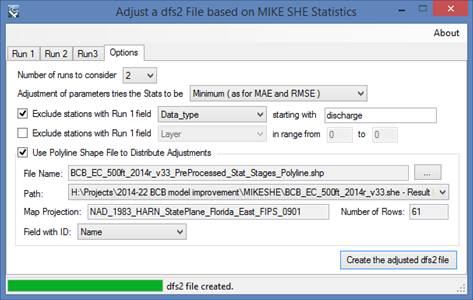
The user must specify the two or three point shape files with the MIKE SHE statistics from the corresponding simulations, as well as the dfs2 files and items with the parameter maps. This approach assumes that the effect on the statistics is caused only by the variation of the specified parameter map, so it is recommended to keep all other setup parameters equal during the sensitivity test. Also, in the case of working with three simulations, the tool assumes that the first run uses central value parameters, and so, the second and third runs are variations from this map in opposite directions. The stations in the statistic shape files are matched based on an ID field (e.g. ‘Name’). The field with the statistic value (e.g., ‘MAE’) should be also specified. By default, the tool consider the minimum statistic value as the best result, which is the case for the ‘MAE’ and ‘RMSE’, but the user has also the option to consider the best statistic value as zero (as in the case of the ‘ME’) or as maximum (as in the case of ‘R’). Optionally, the user can exclude stations with specific field values (e.g., ‘Data-type’ starting with discharge) and also numeric field values (e.g., ‘Layer’) in a range. The user can specify a polyline shape file and an ID field. In the stations with matching IDs, the station location point will be replaced by several points generated along the polyline path (with a maximum distance of half-cell width). The weight of these generated points is reduced in proportion to the number of points used in order to keep the overall influence of the given station. When the tool is executed, an intermediate dfs2 file is produced with a map of the “choice” of the simulation (or run) in the range [0, 1] for two simulations or [-1, 1] for three simulations. This means that in the cells where the choice is 0, 1, or -1, the parameter of the first, second or third run will be used, respectively, to generate the new parameter map. In the most common case of a choice value inside the range, a linear interpolation is used to find the new parameter. The choice map is built from the best choice at individual stations by using an inverse square distance interpolation method and a weight proportional to the difference in statistic values from the runs. The output dfs2 file will have the structure of the first run dfs2 file, and it will contain the new proposed parameter map. There is an option available in the case of three runs and the adjustment to be maximum or minimum in which the choice could be extrapolated up to 100 %. This means that the choice map would be in a range of [-2, 2], and so the new parameter map may include the extrapolation beyond the run 2 and run 3 variations. The choice value for each station (as well as the stats used for the choice estimation) are listed in the log file in the case that the user wants to take a closer look. The free version allows the user to save up to the first 50x50 elements of the grid Pre-requisites
It requires MIKE ZERO 2012, 2014, 2016, 2017 or 2019 to be installed, but the DHI license is not necessary. Example of use There are no example files included in the installation to try this tool. The printscreens below illustrate the use of the tool for merging two hydraulic conductivity maps during the calibration of a complex MIKE SHE model.
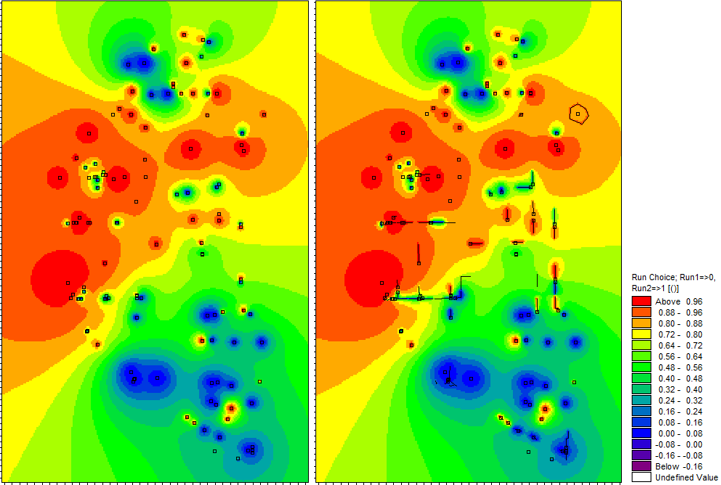
Below are the intermediate maps with the choice generated in two situations: without and with the polyline shape file, respectively. The observation stations are overlaid in these maps as squares with black edges. The polyline shape file is also overlaid as black lines in the second case.
The printscreens below illustrate also the use of the tool in the case of merging three hydraulic conductivity maps.

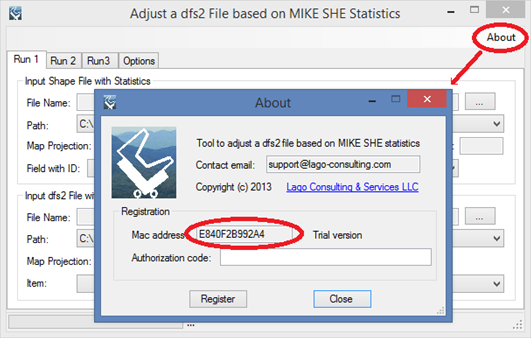
Registration
In order to have full functionality of this tool, the user needs to complete the registration by following these steps:
After these steps, the authorization code will be sent to the email that you provided during the PayPal payment process.
Verifications This tool has been successfully applied in project funded by the BCB office of the SFWMD and titled: BCB MIKE SHE model Upgrade. In this case, the tool was used to merge (two or three) hydraulic conductivity maps during the model calibration task. The new conductivity maps produced by the tool normally produced a MAE close to the minimum MAE from the originating runs. Thus, the average MAE at different stations showed a decreasing trend as the tool was applied repeatedly. Support Users can report bugs and send comments by email to [email protected]. Created by Lago Consulting & Services LLC. © 2015. Last updated on 05/28/2019
|

|